I was a little surprised to look at the blog and see that I seemingly haven't written about how Dragons Abound places labels on the map. I was pretty sure I had. Turns out I was remembering a Reddit post from before I started this blog. That's pretty skimpy, so let me go into a little more detail.
Placing labels is a significant topic in cartography. The seminal paper is by Eduard Imhof from 1975, Positioning Names on Maps. It's a pretty interesting read, even if you're not into maps. With the advent of modern computers and cartography software, there's been a fair amount of effort put into figuring out decent methods of automatic label placement.
Martin O'Leary's original map generator used an ad-hoc approach to placing labels, and it worked okay but it was a bit of a kludge. As Dragons Abound started adding more features and getting more complex, this just wasn't working very well. So I switched over to using an algorithm known as "force layout". Dragons Abound uses d3js for some of its graphics, and d3js has a built-in force layout function, so that seemed like an easy choice (although that didn't turn out to be entirely true!).
The basic idea of force layout is that you treat the labels and other map elements as
objects with forces acting on them, and let them move around until they
find a "comfortable" spot. For example, if you don't want labels to overlap, you use a force that pushes labels apart when they do overlap. Depending upon how you want to lay out your labels, you can combine different forces to achieve different effects. Then the force layout engine runs a little simulation, and at every step of the simulation the force push the labels around. At some point they hopefully all get to "comfortable" positions where there are no forces acting upon them (or a bunch of balancing forces), and that should be a "good" layout. Let me walk through how that works in Dragons Abound.
This image shows a map with cities, city names, and region names (e.g., "Maualaus" is a region name). The purple boxes show the size of the labels and the green boxes show the size of the city symbols. The labels start on top of the cities and consequently
hard to read. Initially, there are two forces in Dragons Abound. The first causes elements that are colliding (on top of each other) to push off
against the collision. The second is an attractive force that pulls labels towards their anchors, e.g., that tries to keep the city labels near the city symbols.
(As it turned out, although d3js has a force layout component, the forces it implements were not very suitable for this problem, so I had to code up a couple of new force implementations.)
Let's run the simulation with those two forces.
In this image, red shows the original placement of the label, and purple the current
placement. Note how "Kusun" (for example) has moved downwards until it
is no longer overlapping the city symbol. This is better, but if you look on the top half of the map you'll see "Aukusun" and "Auuk Kienu" are on top of the coastlines. That's not ideal. I already have a force that pushes away two colliding objects, so I can use that to push things off the coastlines by making each little segment of the coastline an object to avoid (a green box).
In this image, the green boxes identify all the segments of the coastline. Labels that overlap these boxes get a force pushing them away. You can see that "Aukusun" has moved downwards and "Auuk Kienu" to the right to avoid the
coastlines. Also notice how "Auuk Kienu" was stopped by running into the opposing
coastline.
Another problem in this map is that some of the labels are overlapping rivers (e.g., "Maualaus"). So the next step is to add the rivers as features to avoid.
Each segment of the river has been made an object to avoid, and the labels have now moved off the rivers. Note that "Isaulni Muun" moved
quite a distance but is still visually pretty close to it's symbol -- the attractive force is keeping it nearby. Unfortunately, "Isaulni Muun" is overlapping a border, so I need to do the same thing to force labels away from borders.
Now "Isaulni Muun" has moved downward to minimize its overlap with the border while still staying fairly close to its city symbol. On the other hand, "Lausunpam" has hardly moved at all. It is caught between a river and a border. The opposing forces cancel out and the label doesn't go anywhere (or ping pongs slow back and forth). The situation is even worse for "Auuk Kienu" near the top of the map -- being pushed away from the border has caused it to go from overlapping just the border to overlapping both the border and the coast!
Here's an animation that shows the steps:
Unfortunately, the kind of problems that show up in the last step are typical for force layout. It's pretty easy for labels to get "trapped" in a poor location with forces pressing in from all sides, when there's a much better location just on the other side of one of the forces. In computing terms, this is known as getting stuck in a local minima. A better labeling algorithm would have a way to escape these local minima. I'll talk about one next time.
I've been programming a long time (i.e., I predate the personal computer) and my usual programming style is somewhat dated. One of the things I've been slowly doing on this project is learning about and incorporating some of the more modern features of Javascript, including functional programming idioms and ES6 syntax. Occasionally I mention that I stopped in the middle of this or that effort to refactor my code. In this posting will look at how I refactored a section of code to use some of these newer language features.
(This is a bit of left-turn from my usual content, so feel free to skip ahead if this isn't your sort of thing.)
The code I'll look at is from drawing the forests. It's the portion of the code that avoids drawing where there are mountains. Here's the code as I originally wrote it:
        //
        //  Create a list of all the bounding boxes of the mountains we've drawn, so that
        //  we can avoid drawing forest where they're at.
        //
        let mtnBBs = [];
        for(let i=0;i<world.mountains.length;i++) {
            let rect = world.mountains[i].node().getBBox();
            mtnBBs.push([[rect.x-(rect.width*0.5), rect.y-(rect.height*0.75)],
                         [rect.x+rect.width*1.5, rect.y+rect.height*1.75]]);
        };
        function collideBBs(i) {
            let x = world.loc[i].coords[0]*1000;
            let y = world.loc[i].coords[1]*1000;
            for(let i=0;i<mtnBBs.length;i++) {
                let mtnBB = mtnBBs[i];
                let left = mtnBB[0][0];
                let top = mtnBB[0][1];
                let right = mtnBB[1][0];
                let bottom = mtnBB[1][1];
                if (x >= left && x <= right && y >= top && y <= bottom) {
                    return true;
                };
            };
            return false;
        };
        //
        //  Later used as:  collideBBs(i)
        //
The code is a pretty straightforward procedural approach, relying on for-loops to iterate through arrays. The first part of the code creates a list of all the bounding boxes of mountains in the world, "mtnBBs". The second part is a function that checks to see if location "i" in the world is within one of these bounding boxes.
Let's tackle the first part of this code, that builds the array of mountain bounding boxes. The pattern of walking through an existing array and building up a new array is very common, so Javascript arrays now have a functionality called "map" that takes a function, applies it to every element of the array, and then returns an array of the results. So let me use that to build the "mtnBBs" array.
        function toBB(mtn) {
            let rect = mtn.node().getBBox();
            return [[rect.x-(rect.width*0.5), rect.y-(rect.height*0.75)],
                    [rect.x+rect.width*1.5, rect.y+rect.height*1.75]];
        };
        const mtnBBs = world.mountains.map(toBB);
What I've done here is take the interior portion of the for loop and turned it into a function that returns the bounding box, and then replaced the for loop with a call to "map()". I realized that "mtnBBs" never changes after I create it, so I declared it as a constant rather than a variable; this helps the browser run the code more efficiently.
You might notice looking at the "toBB" function above, that it comprises two steps: the first turns a mtn into an SVG bounding box, and the second turns that into an array of two coordinates. So it seems like we could do this with two "maps" -- the first to turn mtns into SVG bounding boxes, and the second to turn the SVG bounding boxes into the coordinate arrays. That looks like this:
        function toBB(mtn) { return mtn.node().getBBox();}
        function toCoords(rect) {
            return [[rect.x-(rect.width*0.5), rect.y-(rect.height*0.75)],
                    [rect.x+rect.width*1.5, rect.y+rect.height*1.75]];
        };
        const mtnBBs = world.mountains.map(toBB).map(toCoords);
Notice how the map calls are chained together in the last line -- first "toBB" is applied to mountains to create an array of SVG bounding boxes, and then "toCoords" is applied to that array to create the array of coordinates.
It's a little awkward to have to write a whole function for the little bit of functionality in something like "toBB" so Javascript introduced a shorthand method for writing these sorts of little functions called the "fat arrow". The fat arrow lets you write a short simple function in this format:
x => Math.sqrt(x)
This little example defines a function that takes a value "x" and returns the square root. I can use the fat arrow format to make this code a little simpler.
Not having to define "throwaway" functions separately makes the code a lot cleaner and compact.
Now let's look at the "collideBBs" function:
        function collideBBs(i) {
            let x = world.loc[i].coords[0]*1000;
            let y = world.loc[i].coords[1]*1000;
            for(let i=0;i<mtnBBs.length;i++) {
                let mtnBB = mtnBBs[i];
                let left = mtnBB[0][0];
                let top = mtnBB[0][1];
                let right = mtnBB[1][0];
                let bottom = mtnBB[1][1];
                if (x >= left && x <= right && y >= top && y <= bottom) {
                    return true;
                };
            };
            return false;
        };
The second part of this walks through the "mtnBBs" array, but it exits early -- the first time it finds a location inside a bounding box, so we can't use map() in this case. However, this use case "find the first element of an array that meets a condition" is also very common, so Javascript provides this functionality in something called "find". It works about how you'd expect.
        function collideBBs(i) {
            let x = world.loc[i].coords[0]*1000;
            let y = world.loc[i].coords[1]*1000;
            function within (mtnBB) {
                let left = mtnBB[0][0];
                let top = mtnBB[0][1];
                let right = mtnBB[1][0];
                let bottom = mtnBB[1][1];
                return (x >= left && x <= right && y >= top && y <= bottom);
            };
            return mtnBBs.find(within);
        };
Here I've broken out the condition I was testing into a new function "within" and then used find to apply that to the mtnBBs until I find the first one. Again, I can simplify this by turning "within" into a fat arrow function:
        function collideBBs(i) {
            let x = world.loc[i].coords[0]*1000;
            let y = world.loc[i].coords[1]*1000;
            return mtnBBs.find(m => x >= m[0][0] && x <= m[1][0] &&
                                    y >= m[0][1] && y <= m[1][1]);
        };
Now the only real reason for the collideBBs function is to define the temporary "x" and "y" variables. I could just substitute the long expressions into the fat arrow function, but it would be more understandable code if I could incorporate the definition of x and y into the fat arrow function. It turns out you can have multiple statements in a fat arrow function. The only caveats are that you have to enclose the statements in braces, and you need to explicitly return a result.
 function collideBBs(i) {
     return mtnBBs.find(m => {
               const x = world.loc[i].coords[0]*1000;
               const y = world.loc[i].coords[1]*1000;
               return x >= m[0][0] && x <= m[1][0] && y >= m[0][1] && y <= m[1][1];} );
 };
I usually prefer to use single-line fat arrow functions, but this case seems tolerable.
At this point I no longer need the collideBBs function, I can just substitute the return expression where I was using collideBBs. If I only need to do this once I can combine everything into one statement:
        world.mountains
            .map(mtn => mtn.node().getBBox())
            .map(rect => [[rect.x-(rect.width*0.5), rect.y-(rect.height*0.75)],
                          [rect.x+rect.width*1.5, rect.y+rect.height*1.75]])
            .find(m => {
                let x = world.loc[i].coords[0]*1000;
                let y = world.loc[i].coords[1]*1000;
                return x >= m[0][0] && x <= m[1][0] && y >= m[0][1] && y <= m[1][1];} )
For me, the readability of deeply-chained functions is poor, but that's probably just my old school background talking. I see lots of code like this, so clearly many programmer like it fine.
Dragons Abound models rivers based upon flux: the amount of water flowing through a location. Precipitation falls on the land, is partly used up by evaporation and plants, and the rest flows downhill as flux. The width of rivers is based upon the amount of flux, so rivers get wider as they flow downhill to the sea.
Now I'm not a hydrologist, but if I were, I'd probably tell you that's a pretty simple model of river size. (Well, to be fair, if I were a hydrologist I probably wouldn't be doing this as my fun side project so I wouldn't be telling you anything, but you get my point.) A better model would take into account how fast the river is flowing. A faster river carries away more water, so for two rivers with the same flux, the slower river will be wider.
In the real world, rivers vary in size as they go faster or slower. An extreme example is the Swan River in Perth, Australia:
Here's another view:
You can see the width of the river varies drastically. I've never been to Perth, but I imagine the river flows more quickly in the narrower parts and more slowly in the wide parts.
I'm sure there are many factors affecting how fast a river can flow, but for my purposes I'll use the slope of the underlying land. A steeper slope will mean faster moving water. The width of the river in a location is then proportional to the flux divided by the slope:
The constant C here adjusts how important the slope is in determining the width of the river -- the larger the constant, the less important the slope. Here's an animation showing the change from just using flux to using slope with different values of C:
As C decreases, the upper parts of the river where the slope is higher (and the river flows faster) shrink in width.
One nice feature of this approach is that it's possible to have a river broaden as it goes through a flat area and then narrow as the slope increases.
Here you can see a river changing size as it hits flat areas. You can imagine, too, waterfalls where the two rivers flow over a short steep slope into another flat area.
The original screen capture for the map with the two waterfalls looked a little different:
Why the odd pill-shaped lakes? The explanation has to do with the way Dragons Abound draws rivers.
Rivers are drawn as lines (paths) of the proper width. To make a river with a black border (like in the map above) I draw a slightly wider river in black and then a slightly narrower river in blue on top of it. This works fairly well, but one drawback is that SVG doesn't have a way to change the parameters of a line (such as it's width) as it is being drawn. So when Dragons Abound needs to change the width of the river, it has to stop the current line and start a new line. This worked fine for flux-based lines because flux doesn't change much between two neighboring locations on the river. Most of the flux for a location comes from the upstream location, so the flux tends to gradually increase. Consequently, the width of the river gradually increases, about a 1/4 point of width at a time, and that looks smooth to the user.
But with the switch to flux + slope based width, it's possible for the width of the river to change pretty drastically from one location to its neighbor. That's what's happening with the pill-shaped lakes in the map above. That's actually a short line of the proper width -- with rounded ends, which is why it looks like a pill.
The fix when this happens is to take that segment of the river and break it up into a bunch of smaller segments, changing the size by a 1/4 point of width in each of the new segments, so the river seems to smoothly swell (or contract). This yields the map (shown above) with the more natural-looking river swells.
For some time I've had an odd problem with putting labels on the map. They would overlap other labels or land features when they weren't supposed to be overlapping. After some digging, it turned out that the browser was calculating the bounding boxes for the labels incorrectly:
Here the purple boxes show the bounding boxes for the labels. These are calculated by the browser, and you can see that they're too short for most of these labels. How could that be? It seems unlikely that Chrome has a bug in its bounding box implementation.
After some experimentation, I figured out that this was only happening when I used Web fonts. These are loaded into CSS and then applied to the text on the map. The problem is that browsers are generally (1) lazy and (2) asynchronous. Chrome doesn't load a Web font when it is defined in CSS, but waits until it is actually used in the web page. (This keeps your browser from wasting lots of time and bandwidth fetching fonts that are never used.) Second, Chrome continues on with other work while it is waiting for the font to be downloaded across the Web. So in this case, the font loading doesn't start until the labels on the map are being displayed -- which is long after I've randomly selected a font for the map and tried to measure the labels. So how does Chrome measure the labels before the font is loaded? When the styled font is unavailable, the browser fails back to a default system font. So the bounding boxes shown up above are based upon displaying the label in a system font (Helvetica in this case).
The solution is to force the browser to load up all the possible fonts before I try to generate the map. (As long as I start the font loads first, they'll likely finish before the map generation, which takes about a minute or so.) So when the browser first loads the page that generates the map, I iterate through all the possible fonts, add them to the CSS for the page, and then put an element on the page that uses the font. It turns out that the element using the font has to be visible (that is, you can't use "display:none") but it doesn't actually have to contain any text. So it is sufficient to stick an empty <span> element into the page for every possible font. After that, the bounding boxes are calculated correctly:
This blog post covers a few miscellaneous and unrelated issues I've been fixing up.
Some time ago I added the capability to color mountains with gradients. When used with white as the top gradient, it creates snow-capped mountains:
What may not be obvious there is that every mountain has the same amount of "snow" regardless of height. At the time I implemented that, every mountain was essentially the same height, so this was mostly irrelevant. But when I changed my mountain symbol approach, there were mountains of many different heights, but they all got the same amount of snow:
You can see here that even the tiniest hills have "snow". What I really want is for the snow to start at a certain height consistently across the mountains. Because I draw mountains at one scale and size them to the map in a separate step and other factors, that turned out to be a bit more challenging than I expected. Eventually figured out the right incantations:
You can see now that only a couple of the tallest mountains have white summits. I also switched over to a radial gradient so that the snow line curves around the mountains, but to be honest the effect is pretty subtle.
When generating rivers, I push down the terrain where the river runs. This puts each river in a small valley, and when I generate a map using psuedo-3D shading, the rivers get nice shadows, as you can see on the river system near the bottom of this map.
It occurred to me that I could get a similar effect even when I'm not generating 3D shading by using the same technique I use to put dark shading on the coast. I could draw a dark line under the river and then blur it to create a shadow along the river:
This actually works pretty well, but a fairly easy improvement is to offset the shadow in the direction of the sun, and offset an "anti-shadow" away from the sun, so that the rivers get a bright and dark side, as with the real shading:
This works very well when the map has forest masses, since the shadows from the forest mass reinforce the shadows on the river banks and vice versa.
By the way, the sun direction is pretty much hard-coded into the program. When I eventually get around to enabling the light direction to come from either direction I'm going to have some work to do.
Dragons Abound has a mode for producing a "geopolitical" map where each country or political region is given a different map color:
That's kind of a cool look -- it reminds me of the maps from my school books. I also wanted a version that identified countries in a more subtle way. The way this map from Maxime Plasse over at the Cartographer's Guild handled political divisions struck my eye:
The soft colors along the borders help distinguish the political units without obscuring the other map features. To add this to Dragons Abound I draw a line of the appropriate color along the border and then apply a significant amount of blur. Unlike Maxime's map, I don't draw the color along the coast, and I put it under features like mountains. To keep it from blurring into the adjacent country, it is clipped to the country it represents.
I like the subtle color overlay this creates and thought it might look good if it covered the entire country but still let the terrain underneath show through. To do this, I filled the country with the regular terrain and then used SVG to overlay a transparent version of the country's geopolitical color.
Generally this looks good, but you can see there's a problem with the mountains. The mountains are added after the rest of the land is filled, and their color is set to be the color of the underlying terrain. So the mountains don't have the overlay color mixed in -- they're just the color of the underlying land. One solution would be to draw the mountains before adding the overlay color, but this would have the bad effect of adding the overlay color to the "snow" at the top of the mountain.
A better solution is to mix the overlay color into the terrain itself (rather than use an SVG overlay), so that when the mountains pick up the terrain color it already has the overlay included. But how do you take a background color and an overlay color and mix them together to get the resulting combined color? It turns out this general problem is called alpha compositing. The specific case of overlaying a transparent color on a background has a fairly simple implementation. So I implemented this and (after figuring out the hard way that SVG expects only integer RGB values) this is the result:
As you can see, the mountains now pick up the (composited) land color correctly and the snow is white.
One
problem with this map is that borders and rivers are obscured by
the forest. The solution is to draw the forest first and the borders
and rivers last, but this turns out to be one of those impossible
ordering situations. I want the mountains after the rivers and borders,
and the forests before the rivers and borders, but I also need the
mountains after the forests. (So that I can avoid the mountains when
drawing the forests.) That doesn't work: I can't draw the mountains first *and* last. The solution in this sort of
situation is to draw the mountain on a different layer. Then I can draw
the mountains first, but put its layer on top of the rest of the land
so that it is displayed last.
This
works, but doesn't look particularly good. There's a weird refraction effect where the rivers cross the psuedo-3D forests, for one thing. Looking
at sample maps that use forest masses, most of them part the forests
around the rivers.
So
perhaps it is worthwhile to see if I can do that. This is much like
pushing the forest back from the coast -- but instead of staying a
certain distance away from the sea, I stay a certain distance away from
river locations. The only pitfall here is that I don't want my forest
edges to overlap -- which can happen if I set this distance too low.
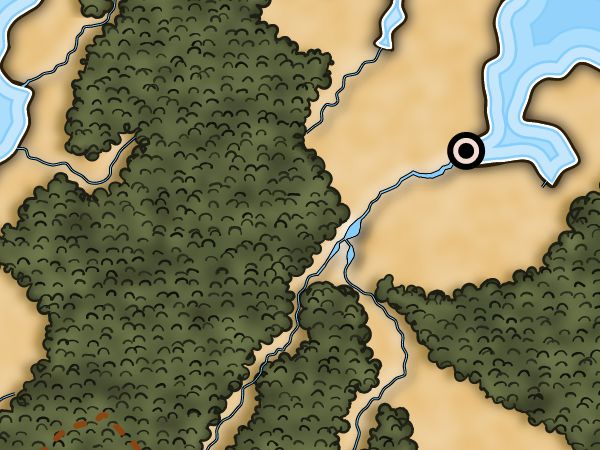
You
can see a couple of spots on this map near the ends of rivers where the
forest edge is getting drawn back on itself. As long as it's only
small spots like that it looks fine.
Another thing you see quite often in maps with forest masses is some interior texture to indicate trees. Sometimes this is just a simple repeated line, sometimes the same kind of bumpy line used to define the edge of the forest mass.
So let me see about adding that texture to my forest masses.
The basic shape used in these textures is just a bump. Sometimes these bumps are peaky (left side of the examples above) and sometimes flatter (right side). These bumps can be fairly widely spaced (upper right) or packed tight (lower left). So it looks like the basic functionality I need is to fill a forest mass with bumps, with a couple of parameters to control bumpiness and spread. This is basically the same algorithm I use to place mountain symbols on the map, although this will be simpler.
Here's a first try:
Nailed it! Although it may benefit from a *few* tweaks.
Okay, that's not too terrible. The bumps are a little too regular in size and shape, though. And the color of the bumps needs to be a darkened version of the forest mass color, not black.
You might notice here that I've also implemented some shadowing around the edges of the land to give the land a little 3-D quality. This implementation is similar to the forest, but in this case I have to avoid this effect on small islands (e.g., in the upper left) or they are too dark.
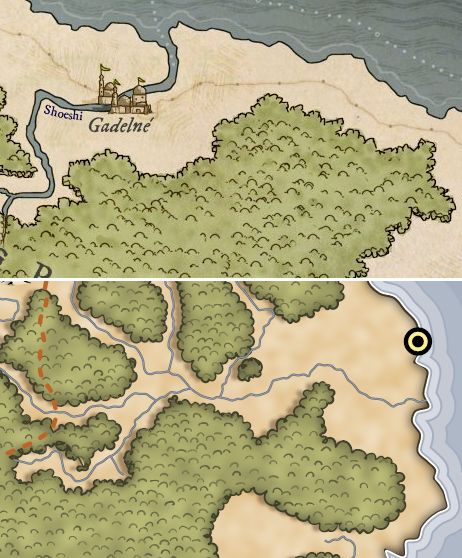
For fun, I did a side-by-side comparison between my forests and one of my example maps:
The match isn't perfect (not that I'm trying to slavishly copy the sample) but I'm happy that this looks good even alongside a nicely hand-drawn map.


 More miscellaneous topics...


 This is where I left off


